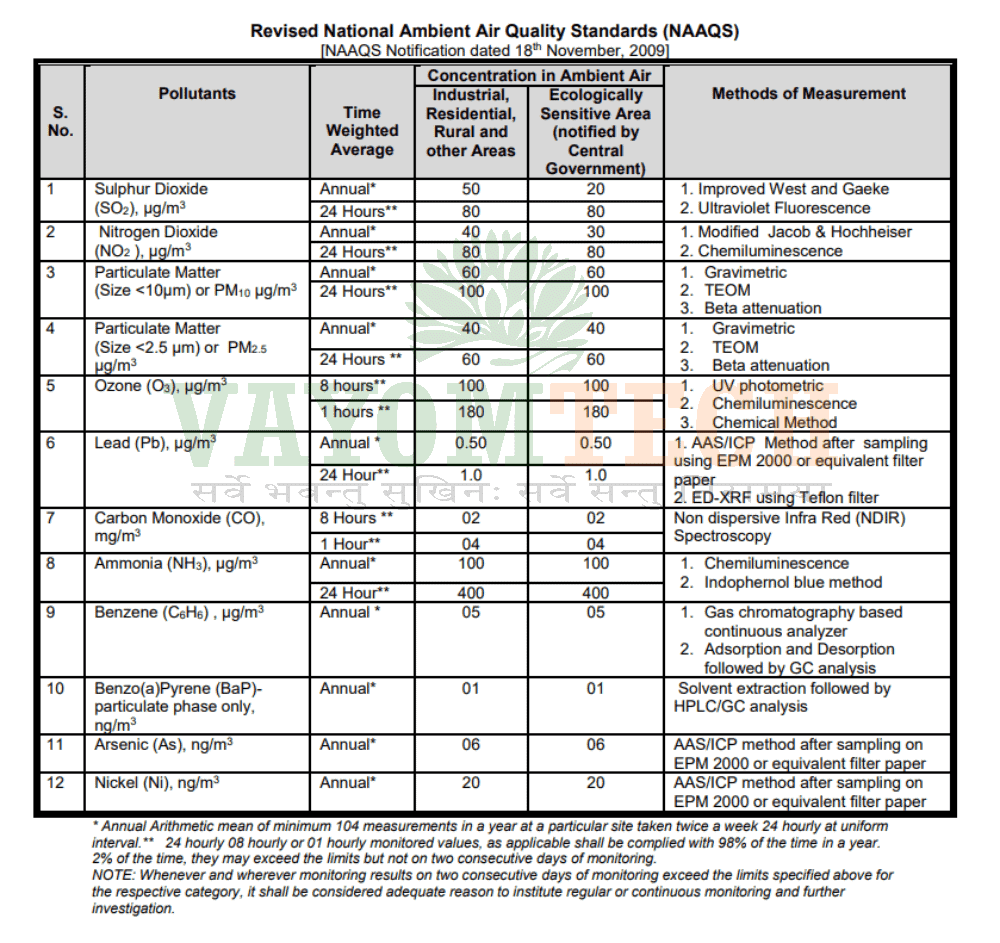


National Ambient Air Quality Standards (NAAQS) are standards for air quality that are set by the Central Pollution Control Board (CPCB) that are applicable all over the country.
The NAAQS set by the CPCB are applicable to the whole country. The CPCB draws this power from the Air (Prevention and Control of Pollution) Act, 1981.
The objectives of air quality standards are:
In order to combat air pollution, it is required to identify the pollutants, its source of emission and investigate the effects of living and the environment. The Central Pollution Control Board has notified the revised National Ambient Air Quality Standards Gazette of India, Extra-ordinary Part-II Section 3, sub section (ii), dated Nov 18, 2009.
The revised National Ambient Air Quality Standards as depicted in top Image.
The current standards (2009) comprise 12 pollutants as follows:
Importance of air quality monitoring Air pollutant, both indoor and outdoor, cause significant harm to health. Therefore, monitoring of pollutants is important for effective air quality management. The Government monitors air quality in different areas to find out how much pollution is in the air and make sure pollutant levels are meeting health – based air quality standards. Knowing how much pollution is in the air in a certain area helps air quality agencies know when and how to take action to protect public health.
The Government uses its air monitoring data to:
Objectives of NAMP
The objectives of the NAMP are as follows:
| National Ambient Air Quality Standards 2009 – Concentration in Ambient Air | ||||
| Pollutant | Time Weighted Average | Industrial, Residential, Rural and Other Area | Ecologically Sensitive Area (notified by Central Government) | Methods of Measurement |
| SO2, μg/m3 | Annual* | 50 | 20 | Improved West and Gaeke Ultraviolet fluorescence |
| 24 hours** | 80 | 80 | ||
| NO2, μg/m3 | Annual* | 40 | 30 | Modified Jacob & Hochheiser (Na-Arsenite) Chemiluminescence |
| 24 hours** | 80 | 80 | ||
| PM10, μg/m3 | Annual* | 60 | 60 | Gravimetric TOEM Beta attenuation |
| 24 hours** | 100 | 100 | ||
| PM2.5, μg/m3 | Annual* | 40 | 40 | Gravimetric TOEM Beta attenuation |
| 24 hours** | 60 | 60 | ||
| O3, μg/m3 | 8 hours** | 100 | 100 | UV photometric Chemiluminescence Chemical Method |
| 1 hour** | 180 | 180 | ||
| Lead (Pb), μg/m3 | Annual* | 0.5 | 0.5 | AAS/ICP method after sampling on EMP 2000 or equivalent filter paper ED-XRF using Teflon filter |
| 24 hours** | 1 | 1 | ||
| CO, mg/m3 | 8 hours** | 2 | 2 | Non Dispersive Infra Red (NDIR) spectrosopy |
| 1 hour** | 4 | 4 | ||
| Ammonia (NH3) μg/m3 | Annual* | 100 | 100 | Chemiluminescence Indophenol blue method |
| 24 hours** | 400 | 400 | ||
| Benzene | Annual* | 5 | 5 | Gas chromatography based on continuous analyzer Adsorption and Desorption followed by GC analysis |
| Benzopyrene (BaP) – particulate phase only, ng/m3 | Annual* | 1 | 1 | Solvent extraction followed by HPLC/GC analysis |
| Arsenic (As), ng/m3 | Annual* | 6 | 6 | AAS/ICP method after sampling on EMP 2000 or equivalent filter paper |
| Nickel (Ni), ng/m3 | Annual* | 20 | 20 | AAS/ICP method after sampling on EMP 2000 or equivalent filter paper |
| * Annual arithmetic mean of minimum 104 measurements in a year at a particular site taken twice a week 24 hourly at uniform intervals. ** 24 hourly or 8 hourly or 1 hourly monitored values, as applicable, shall be compiled with 98% of the time in a year. 2% of the time, theymay exceed the limits but not on two consecutive days of monitoring. Note – Whenever and wherever monitoring results on two consecutive days of monitoring exceed the limits specified above for the respective category, it shall be considered adequate reason to institute regular or continuous monitoring and further investigation. | ||||


